Solar Ledger
A household energy ledger that tracks what our solar panels have actually saved, and when they'll pay for themselves.
- Status
- Personal use
- Launched
- August 2026
- Built with
- JavaScript, SVG, PDF.js, SheetJS, Claude Artifacts
Overview
Solar Ledger is a household energy ledger for our home solar system. It answers the question every solar owner asks: how much has this actually saved, and when will it have paid for itself?
It's a single self-contained page, built as a Claude artifact, that pulls together two sources that never quite agree: the solar monitor's production data and the power company's bills.
The problem
The solar monitor knows how much the panels produced and how much went back to the grid. The power bill knows what was charged, what fell in the free 9pm–midnight window, and what the export buyback paid. Neither one, on its own, tells you what the system has saved.
Working it out by hand means lining up daily monitor data against billing periods that don't match calendar months, across tariff changes, every time a new bill arrives.
What I built
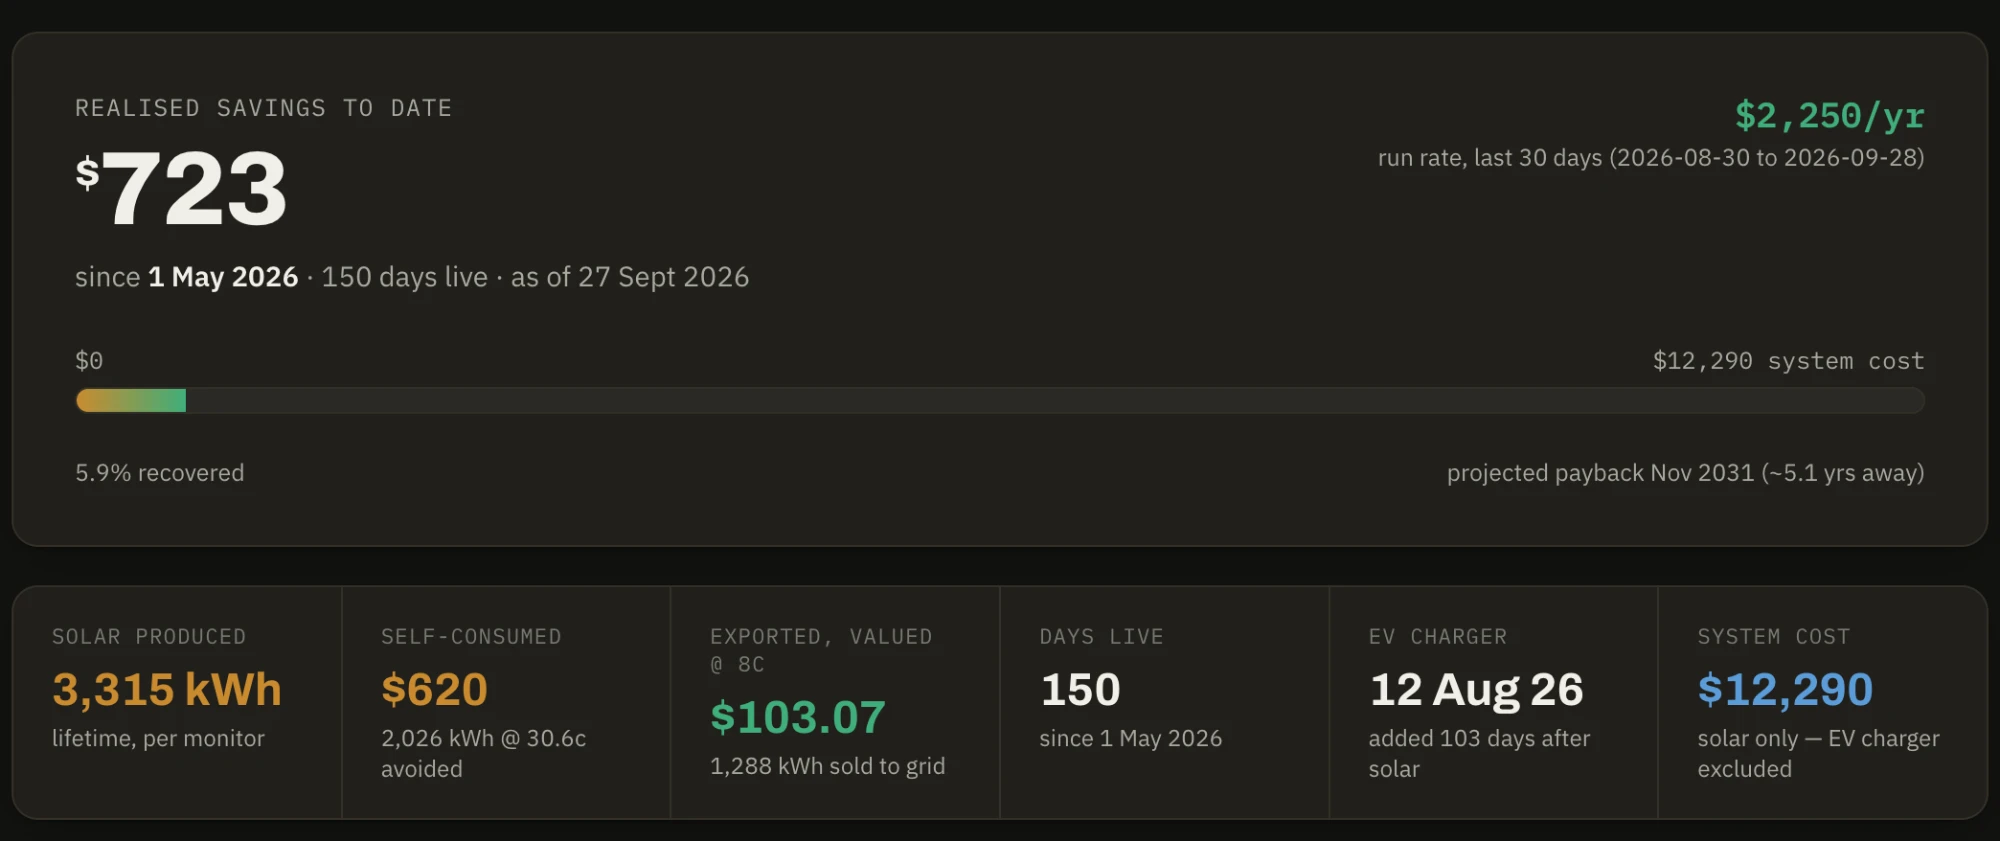
The ledger values self-consumed solar at the charged rate it avoided, and exported power at the flat buyback rate, to give realised savings to date. It projects a run rate from the last 30 days of actual production rather than a lifetime average, and uses that to estimate the payback date against the system's cost.
Data comes in three ways: the monitor's .xlsx export (its lifetime totals and any per-day rows), the power company's PDF bills (several at once, skipping any already on file), and a form for logging a reading by hand. Charts for the savings trajectory, monthly bills and monthly solar output are drawn directly in SVG.
Key features
- Savings and payback
- Realised savings to date, the share of the system cost recovered, and a projected payback date.
- Recent run rate
- Based on the last 30 days of production, so a slow start doesn't drag the projection down.
- Savings trajectory
- Logged savings over time, projected forward to the payback point.
- Bill history
- Monthly charged, free and exported kWh, with the install month marked.
- Monthly solar
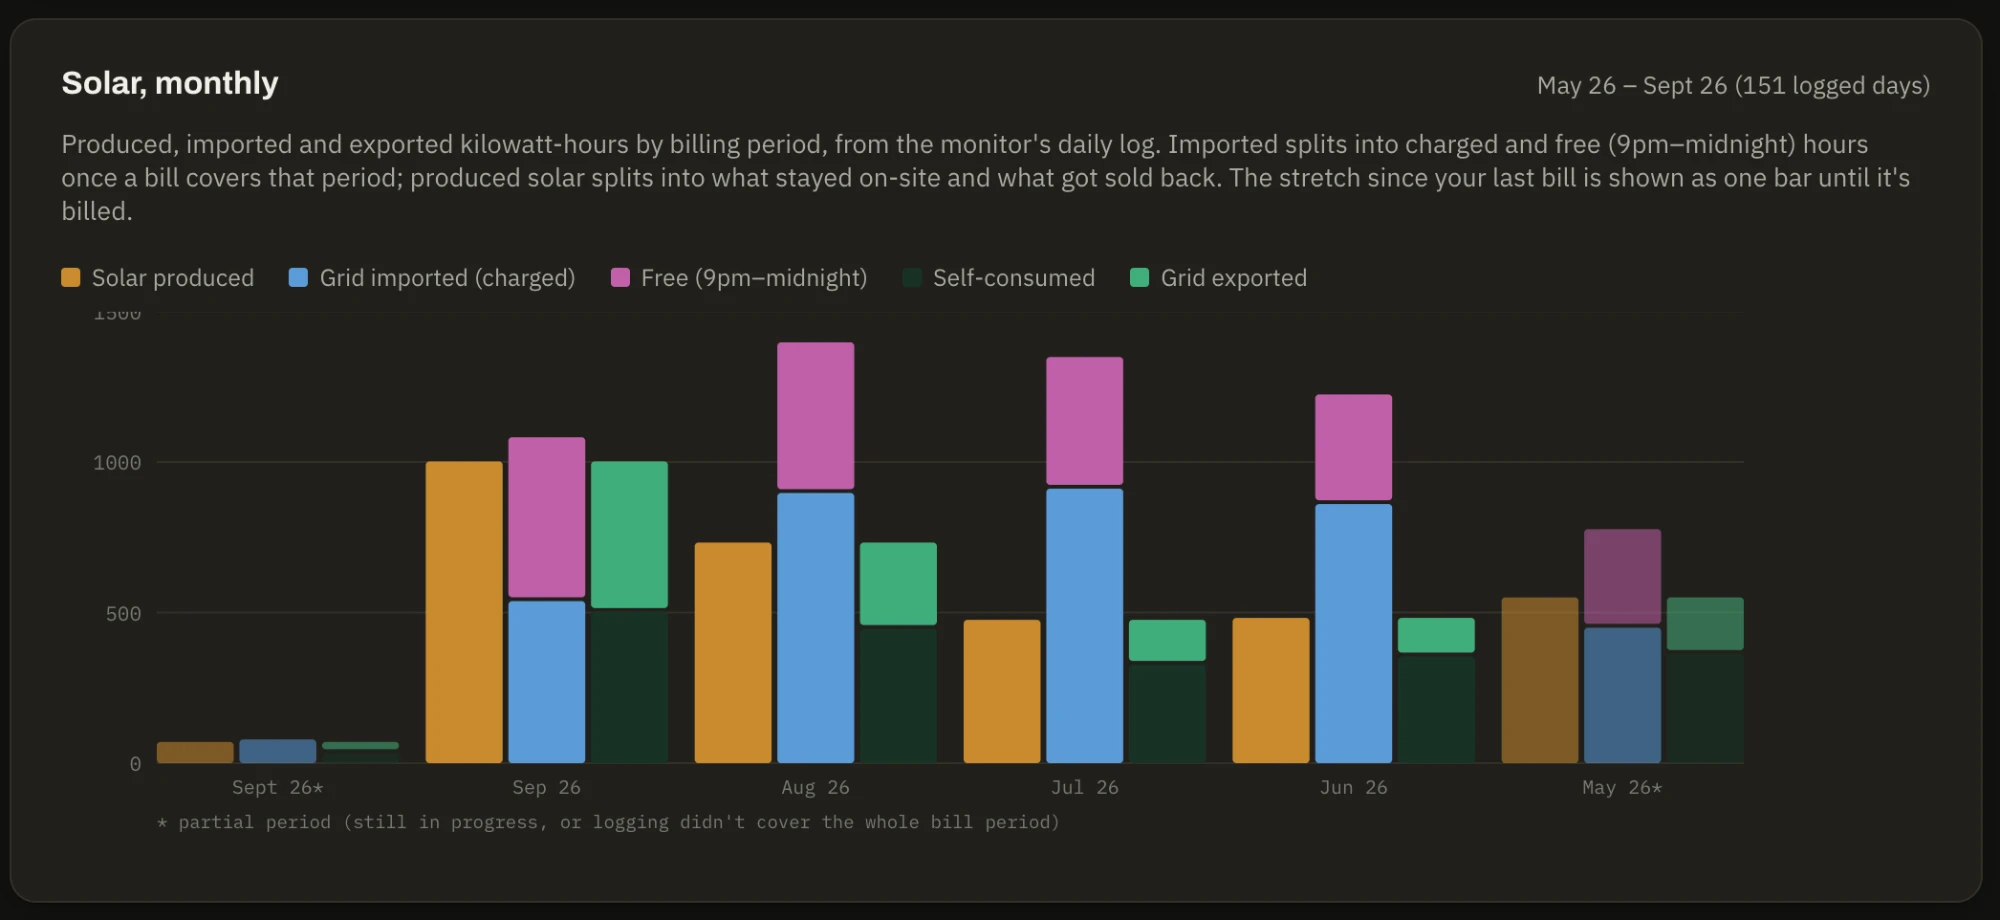
- Produced, imported, exported and self-consumed energy for each billing period.
- PDF bill import
- Reads the billing period, usage, rates and totals straight off the bill.
- Spreadsheet import
- Reads the solar monitor's .xlsx export, including daily rows.
- Self-saving
- New data is written back into the page itself, so it's there for anyone who opens it.
Interesting problems
Two sources that don't line up
The monitor logs by day; the bills cover their own billing periods, which don't match calendar months. Days are bucketed into the bill that actually covers them, and any stretch not yet billed is shown as a single bar. The monitor's totals are kept as the source of truth, and each bill's free-hours figure is used to split imported power into charged and free, which the monitor can't do on its own.
Parsing real bills
The PDF parser has to cope with every bill format the account has used: an older plan, the newer free 9pm–midnight plan, transition bills with two different rates in one period, and buyback lines. Export lines are identified by their negative rate, which is what separates them from usage lines.
Protecting the numbers
The monitor reports lifetime running totals, which can only go up. Any reading lower than the one before it, usually a monthly total pasted in by mistake, is refused before it can wipe out the trajectory. A reading for a day that's already logged is only replaced if the new figure is higher.
A “Sept” bug
Some browsers abbreviate September as “Sept” in New Zealand English while every other month gets three letters, which quietly sorted bills into the wrong place. Bill labels are now built from a fixed list of month names instead of the browser's date formatting, and bills sort by their actual end date.
Decisions & trade-offs
No backend at all
The page stores its data as JSON embedded in its own HTML and republishes itself when something changes. There's no database or server to run, and the data can't drift away from the page that uses it.
Only count what belongs to the solar system
Costs that aren't part of the solar installation are left out of the payback calculation, so the payback date answers the question it's meant to.
Tech
- JavaScript
- SVG
- PDF.js
- SheetJS
- Claude Artifacts
Screenshots